2018
How To Check Laptop CPU Temperature In Ubuntu | It's FOSS
sudo apt-get install psensor
2016
2008
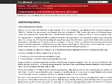
Install and Configure Cacti Monitoring tool in Ubuntu 8.10 (Intrepid Ibex) Server -- Ubuntu Geek
Cacti is a complete network graphing solution designed to harness the power of RRDTool’s data storage and graphing functionality. Cacti provides a fast poller, advanced graph templating, multiple data acquisition methods, and user management features out of the box. All of this is wrapped in an intuitive, easy to use interface that makes sense for LAN-sized installations up to complex networks with hundreds of devices.
Monitoring Servers and Clients using Munin in Ubuntu
“Munin” means “memory”.Munin the tool surveys all your computers and remembers what it saw. It presents all the information in in graphs through a web interface. Its emphasis is on plug and play capabilities. After completing a installation a high number of monitoring plugins will be playing with no more effort. Using Munin you can easily monitor the performance of your computers, networks, SANs, and quite possibly applications as well. It makes it easy to determine “what’s different today” when a performance problem crops up. It makes it easy to see how you’re doing capacity wise on all limited resources.
It uses the excellent RRDTool and is written in Perl. Munin has a master/node architecture in which the master connects to all the nodes at regular intervals and asks them for sdata. It then stores the data in RRD files, and (if needed) updates the graphs. One of the main goals has been ease of creating new plugins (graphs).
How-To: Monitoring a Server with Munin
Munin is a simple to configure tool that make real nice graph about your server status. It can actually deal with almost any aspect of your server (load average, network cards status, CPU usage, memory usage, postfix, exim4, mysql ...) without spending much time in configuring it.
Munin produce MRTG likes graph so you can easily see how your server health is going.

Create Disk Usage Reports with durep -- Ubuntu Geek
urep is a perl script used for disk usage reports. It can generate text output with bar graphs to allow easy comparisons of disk usage between directories. It can also generate web pages which can be navigated through the directory structure. This allows easy visual monitoring of disk usage. durep was designed for monitoring disk usage in a more visual way than du. The du program works fine but doesn’t allow a lot of control over how the results are displayed. This perl script is designed to produce output more useful for reports.
2007
Network traffic analyzer for Your Ubuntu System
Darkstat is a network statistics gatherer.Effectively, it’s a packet sniffer which runs as a background process on a cable/DSL router, gathers all sorts of useless but interesting statistics,and serves them over HTTP.

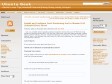
ZABBIX :: An Enterprise-Class Open Source Distributed Monitoring Solution
ZABBIX offers advanced monitoring, alerting and visualisation features today which are missing in other monitoring systems, even some of the best commercial ones.
zabbix
La gestion d'un parc de serveur est un travail de chaque instant. Un bon administrateur système doit savoir à tout moment l'état des différentes machines et des différents services. Un autre aspect clé est que l'administrateur ne peut pas se permettre de passer son temps devant un tableau avec des voyants verts en attendant qu'un voyant passe au rouge pour agir. Son temps est occupé à d'autres tâches et il ne peut donc pas surveiller le tableau de statut en permanence.
Tutorial d'installation d'Oreon
Cette documentation a été réalisé avec une Debian Sarge 3.1
2006

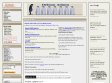
Installing Zenoss Network Monitor on a Ubuntu Server | HowtoForge - Linux Howtos and Tutorials
This tutorial shows how to install and configure the Zenoss network monitoring tool on a Ubuntu 6.06 system. Zenoss is a free open-source tool that allows you to monitor servers, applications, networks, power, etc. regarding their configuration, availability, performance, and so on. It can also alert you by email if it finds inappropriate actions.
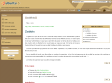
Network,Server statistics graphing Using Cacti in Ubuntu Server
Network,Server statistics graphing Using Cacti in Ubuntu Server
1
(14 marks)

