2012

Morris.js
Morris.js is a lightweight library that uses jQuery and Raphaël to make drawing time-series graphs easy.
2010

LessaWorld.com - Flot Canvas Text Project
A jQuery Flot plugin, which allows to export as PNG the canvas files generated with Flot.
2008
jQuery Google Charting
A jQuery plugin that sets a division to request a Google chart.
jQuery Google Charting
A jQuery plugin that sets a division to request a Google chart.

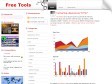
Free Tools, Le meilleur des outils gratuits pour webmaster» Blog Archive » FgCharting, diagrammes “HTML”
FgCharting est un plug in jQuery qui permet de créer des diagrammes depuis des données contenues dans des tableaux HTML standards (”table”, “/table”). FgCharting, pour afficher le diagramme, s’appuie sur le tag “canvas” (voir article - Utililser le tag “canvas” avec Internet Explorer).
2007
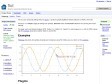
flot - Google Code
Flot is a pure Javascript plotting library for jQuery. It produces graphical plots of arbitrary datasets on-the-fly client-side.
1
(12 marks)

