2014
The 20 Most Powerful Storytelling Videos of 2013 | Visual.ly Blog
Animated videos are quickly becoming a leading medium of choice for impactful story telling. That’s hardly surprising, considering how difficult it is to grab – and hold! – the attention of an audience these days.

Bootiful Game: Football infographics
The Bootiful Game is a website devoted to making football data: potentially interesting, possibly funny, and hopefully lovely to look at too.

True Detective / by Nigel Evan Dennis
We keep the other bad men from the door.
2013

Understanding your online privacy: a (really long) infographic
Understanding your online privacy: a (really long) infographic

Infographic: Life Inside The Kowloon Walled City | ArchDaily
Bienvenue dans le labyrinthe architectural de Kowloon City.
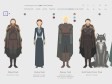
Game of Thrones / by Nigel Evan Dennis
by 2 othersThat is probably the best question. I love design. I love 'Game of Thrones'. The story and the characters of the show fuel the outlet. The outlet being this website. I also believe it is important to step outside of your creative comfort zone and develop some new "chops". These are some new chops for me, and using the subject matter of such an enthralling and vast show furthers those chops. 'Game of Thrones' is a serious milestone in TV history. This has truly been one of my favorite projects and in turn, I hope you enjoy.

Wealth Inequality in America - YouTube
Infographics on the distribution of wealth in America, highlighting both the inequality and the difference between our perception of inequality and the actual numbers. The reality is often not what we think it is.
2012


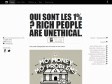
Qui sont les 1% ? Rich People Are Unethical. - davduf.net
QUI SONT LES 1% ? RICH
PEOPLE ARE UNETHICAL.
Datavisualization.ch Selected Tools
by 4 othersDatavisualization.ch Selected Tools is a collection of tools that we, the people behind Datavisualization.ch, work with on a daily basis and recommend warmly. This is not a list of everything out there, but instead a thoughtfully curated selection of our favourite tools that will make your life easier creating meaningful and beautiful data visualizations.
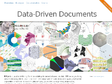
D3.js - Data-Driven Documents
by 7 othersD3.js is a JavaScript library for manipulating documents based on data. D3 helps you bring data to life using HTML, SVG and CSS. D3’s emphasis on web standards gives you the full capabilities of modern browsers without tying yourself to a proprietary framework, combining powerful visualization components and a data-driven approach to DOM manipulation.
easel.ly | create and share visual ideas online
by 6 otherscreate and share visual ideas online
vhemes are visual themes. drag and drop a vheme onto your canvas for easy creation of your visual idea!
Infographics and charts - interactive data visualization | Infogr.am
by 11 others"Infogr.am's product is gunning to be a kind of Adobe Illustrator for online, allowing anyone to create cool info-graphics."


Create Infographics | Visual.ly
Générateur d'infographies
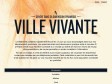
Ville Vivante
Le téléphone portable a rapidement évolué en un outil qui nous accompagne dans tous nos déplacements quotidiens. Les antennes-relais sont devenues en quelque sorte le nouveau fil d'Ariane censé nous maintenir connecté à un monde qui tolère de moins en moins de ne pas être accessible ou de ne pas permettre un accès immédiat à l'information.
Fort de ce constat, la Ville de Genève a pris le pari audacieux de visualiser les empreintes numériques laissées par nos téléphones portables. Cette installation a pour but de sensibiliser et de questionner les gens sur une nouvelle manière de lire les flux d'une population connectée au quotidien.

